
Zayla Partners recently conducted a market study on Houston executive compensation, CEOs, at public companies within Houston’s metropolitan area. Utilizing data from proxy statements filed in 2022, Zayla noted various key findings on Houston’s top paid CEOs. Check out our updated observations and perspectives in our 2023/2024 analysis.
Compensation information for fiscal year 2021 from the companies listed below was gathered from SEC filings made available between January 1, 2022 – December 31, 2022. Analyzing summary compensation table values for 149 CEOs , Zayla noted companies reported an average total CEO pay of $6,075,900 annually. Median total direct compensation for Houston CEOs was $4,253,900.
How Much Does A CEO Make in Houston, TX?
On average, 11% of total compensation reported for Houston CEOs was delivered in the form of base salary ($702,000). A significant portion of total direct compensation – 86% – was delivered in the form of incentive pay between short and long-term incentive elements. This heavy delivery of performance based pay reflects the growing push from shareholders and institutional investors to align CEO pay with shareholder performance.
| Company | Name | Salary | Total Annual Incentives | Stock Awards | Option Awards | Chg Pension NQDC Excess Earnings | All Other | Total Compensation | Revenue (millions) | Industry |
|---|---|---|---|---|---|---|---|---|---|---|
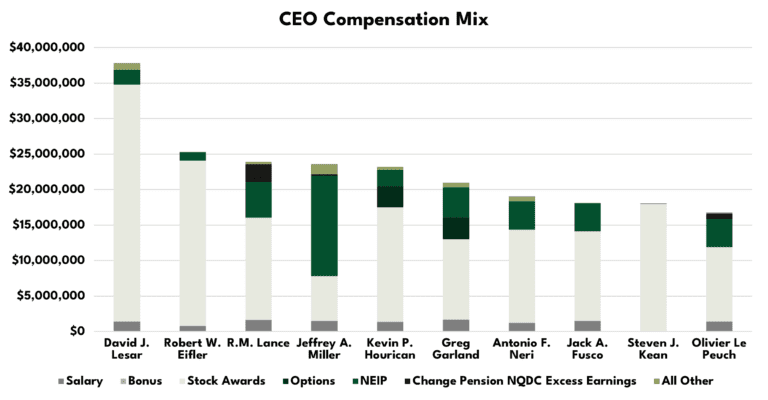
| CenterPoint Energy, Inc. | David J. Lesar | $1,425,000 | $2,116,125 | $33,359,999 | $0 | $0 | $908,686 | $37,809,810 | $8,352 | Utilities |
| Noble Corp | Robert W. Eifler | $800,000 | $1,179,200 | $23,298,341 | $0 | $0 | $8,600 | $25,286,141 | $782 | Energy |
| ConocoPhillips | R.M. Lance | $1,615,000 | $5,038,800 | $14,405,706 | $0 | $2,515,751 | $311,383 | $23,886,640 | $46,660 | Energy |
| Halliburton Company | Jeffrey A. Miller | $1,500,000 | $14,131,664 | $6,300,070 | $0 | $242,327 | $1,417,921 | $23,591,982 | $15,295 | Energy |
| Sysco Corporation | Kevin P. Hourican | $1,350,000 | $2,272,725 | $16,130,478 | $3,024,753 | $0 | $419,168 | $23,197,124 | $51,298 | Consumer Staples |
| Phillips 66 | Greg Garland | $1,675,008 | $4,154,020 | $11,318,245 | $3,140,920 | $0 | $665,013 | $20,953,206 | $111,476 | Energy |
| Hewlett Packard Enterprise Company | Antonio F. Neri | $1,225,000 | $4,005,970 | $13,118,823 | $0 | $16,091 | $686,531 | $19,052,415 | $27,784 | Information Technology |
| Cheniere Energy, Inc. | Jack A. Fusco | $1,500,000 | $3,960,500 | $12,608,398 | $0 | $0 | $22,186 | $18,091,084 | $17,531 | Energy |
| Kinder Morgan, Inc. | Steven J. Kean | $0 | $0 | $18,000,005 | $0 | $253 | $0 | $18,000,259 | $16,610 | Energy |
| Schlumberger Limited | Olivier Le Peuch | $1,400,000 | $3,916,100 | $10,499,803 | $0 | $802,703 | $176,896 | $16,795,502 | $22,929 | Energy |
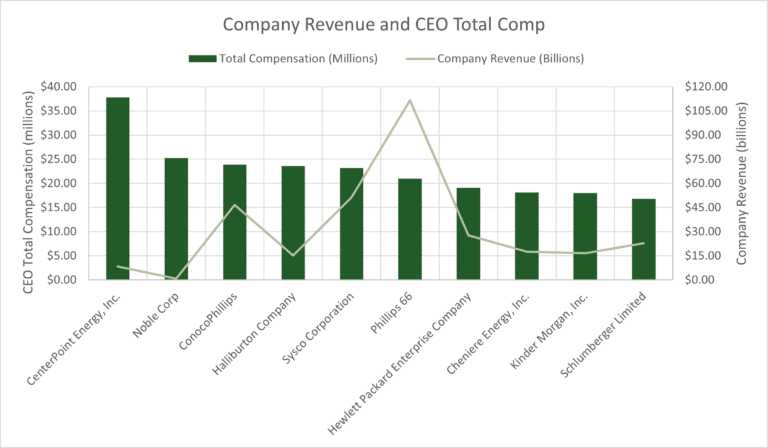
Zayla analyzed the relationships between financials and CEO compensation for fiscal year 2021 across the 149 company universe. On median bases, companies in the Consumer Discretionary industry had the highest revenue and CEO pay, followed by companies in the Industrials and then Energy industries.
Among the 149 CEOs analyzed, Zayla notes that 145 were men and 4 were women.


David Lesar is CEO of CenterPoint Energy.
This was largely driven by the impact of retention incentives granted to the executive beginning in July 2021.
Salary: $1,425,000
Stock Awards: $33,360,000
Non-Equity Incentive Plan Compensation: $2,116,000
All Other: $909,000
TOTAL COMPENSATION: $37,810,000
*Based on 2021 findings
| Company | Name | Salary | Total Annual Incentive | Stock Awards | Option Awards | Chg Pension NQDC Excess Earnings | All Other | Total Compensation | Revenue | Industry |
|---|---|---|---|---|---|---|---|---|---|---|
| CenterPoint Energy, Inc. | David J. Lesar | $1,425,000 | $2,116,125 | $33,359,999 | $0 | $0 | $908,686 | $37,809,810 | $8,924 | Utilities |
| Noble Corp | Robert W. Eifler | $800,000 | $1,179,200 | $23,298,341 | $0 | $0 | $8,600 | $25,286,141 | $939 | Energy |
| ConocoPhillips | R.M. Lance | $1,615,000 | $5,038,800 | $14,405,706 | $0 | $2,515,751 | $311,383 | $23,886,640 | $80,575 | Energy |
| Halliburton Company | Jeffrey A. Miller | $1,500,000 | $14,131,664 | $6,300,070 | $0 | $242,327 | $1,417,921 | $23,591,982 | $20,297 | Energy |
| Sysco Corporation | Kevin P. Hourican | $1,350,000 | $2,272,725 | $16,130,478 | $3,024,753 | $0 | $419,168 | $23,197,124 | $73,580 | Consumer Staples |
| Phillips 66 | Greg Garland | $1,675,008 | $4,154,020 | $11,318,245 | $3,140,920 | $0 | $665,013 | $20,953,206 | $169,990 | Energy |
| Hewlett Packard Enterprise Company | Antonio F. Neri | $1,225,000 | $4,005,970 | $13,118,823 | $0 | $16,091 | $686,531 | $19,052,415 | $28,496 | Information Technology |
| Cheniere Energy, Inc. | Jack A. Fusco | $1,500,000 | $3,960,500 | $12,608,398 | $0 | $0 | $22,186 | $18,091,084 | $32,473 | Energy |
| Kinder Morgan, Inc. | Steven J. Kean | $1 | $0 | $18,000,005 | $0 | $253 | $0 | $18,000,259 | $19,200 | Energy |
| Schlumberger Limited | Olivier Le Peuch | $1,400,000 | $3,916,100 | $10,499,803 | $0 | $802,703 | $176,896 | $16,795,502 | $28,091 | Energy |
| Baker Hughes Company | Lorenzo Simonelli | $1,494,231 | $2,722,125 | $10,856,292 | $0 | $0 | $573,804 | $15,646,452 | $21,156 | Energy |
| Oasis Petroleum Inc. | Daniel E. Brown | $432,790 | $432,790 | $14,225,450 | $0 | $0 | $18,315 | $15,109,345 | $100 | Real Estate |
| APA Corporation | John J. Christmann | $1,300,000 | $2,531,620 | $10,596,139 | $0 | $0 | $612,948 | $15,040,707 | $10,874 | Energy |
| Targa Resources Corp. | Matthew J. Meloy | $875,000 | $3,500,000 | $10,289,456 | $0 | $0 | $27,484 | $14,691,940 | $21,817 | Energy |
| Crown Castle Inc. | Jay A. Brown | $1,030,000 | $2,966,544 | $10,504,164 | $0 | $0 | $52,802 | $14,553,510 | $6,986 | Real Estate |
| Huntsman Corporation | Peter R. Huntsman | $1,700,000 | $4,002,158 | $8,000,000 | $0 | $0 | $363,983 | $14,066,141 | $9,268 | Materials |
| Waste Management, Inc. | James C. Fish, Jr. | $1,294,231 | $2,656,497 | $7,312,195 | $1,700,005 | $0 | $94,435 | $13,057,363 | $19,698 | Industrials |
| Marathon Oil Corporation | Lee M. Tillman | $1,197,923 | $3,456,010 | $7,849,531 | $0 | $265,159 | $228,669 | $12,997,292 | $7,700 | Energy |
| Weatherford International plc | Girishchandra K. Saligram | $837,500 | $2,444,375 | $9,296,759 | $0 | $0 | $12,435 | $12,591,069 | $4,087 | Energy |
| KBR, Inc. | Stuart J. B. Bradie | $1,169,966 | $6,483,267 | $4,256,264 | $0 | $10,284 | $104,566 | $12,024,347 | $7,455 | Industrials |
| Service Corporation International | Thomas L. Ryan | $1,200,000 | $3,120,000 | $4,257,796 | $1,763,440 | $0 | $1,366,799 | $11,708,035 | $4,124 | Consumer Discretionary |
| NOV Inc. | Clay C. Williams | $940,000 | $337,291 | $8,125,350 | $2,161,279 | $0 | $18,144 | $11,582,064 | $6,681 | Energy |
| Conn’s, Inc. | Chandra R. Holt | $461,538 | $2,223,288 | $8,508,778 | $0 | $0 | $348,214 | $11,541,818 | $1,410 | Consumer Discretionary |
| Academy Sports & Outdoors, Inc. | Ken C. Hicks | $1,100,000 | $3,850,000 | $1,649,980 | $3,349,049 | $0 | $1,535,264 | $11,484,293 | $6,457 | Consumer Discretionary |
| Murphy Oil Corporation | Roger W. Jenkins | $988,856 | $1,950,904 | $7,549,063 | $0 | $477,905 | $414,284 | $11,381,012 | $4,220 | Energy |
| Occidental Petroleum Corporation | Vicki A. Hollub | $1,000,000 | $2,400,000 | $5,512,829 | $1,837,511 | $0 | $318,199 | $11,068,539 | $36,328 | Energy |
| Coterra Energy Inc. | Thomas E. Jorden | $301,673 | $0 | $10,000,000 | $0 | $0 | $760,266 | $11,061,939 | $9,305 | Energy |
| Quanta Services, Inc. | Earl C. (Duke) Austin, Jr. | $1,150,000 | $2,384,813 | $7,170,873 | $0 | $0 | $261,531 | $10,967,217 | $16,581 | Industrials |
| NRG Energy, Inc. | Mauricio Gutierrez | $1,369,385 | $1,707,225 | $7,694,426 | $0 | $0 | $83,188 | $10,854,224 | $30,734 | Utilities |
| Enterprise Products Partners L.P. | A. James Teague | $987,500 | $3,200,000 | $5,197,500 | $0 | $0 | $1,031,514 | $10,416,514 | $58,186 | Energy |
| Westlake Corporation | Albert Chao | $1,162,577 | $3,375,489 | $3,433,737 | $1,714,275 | $0 | $206,641 | $9,892,719 | $16,002 | Materials |
| EOG Resources, Inc. | Ezra Y. Yacob | $687,933 | $1,232,500 | $6,591,486 | $1,027,635 | $0 | $213,333 | $9,752,887 | $29,034 | Energy |
| Insperity, Inc. | Paul J. Sarvadi | $1,082,000 | $2,986,320 | $5,533,922 | $0 | $0 | $21,912 | $9,624,154 | $5,740 | Industrials |
| NextDecade Corporation | Matthew K. Schatzman | $636,458 | $715,000 | $7,851,228 | $0 | $0 | $0 | $9,202,686 | $0 | Energy |
| Western Midstream Partners, LP | Michael P. Ure | $713,462 | $1,400,700 | $6,259,276 | $0 | $0 | $344,607 | $8,718,045 | $3,191 | Energy |
| Group 1 Automotive, Inc. | Earl J. Hesterberg | $1,240,000 | $2,480,000 | $3,799,959 | $0 | $849,078 | $208,220 | $8,577,257 | $16,222 | Consumer Discretionary |
| Crestwood Equity Partners LP | Robert G. Phillips | $800,000 | $2,000,000 | $5,581,674 | $0 | $0 | $158,404 | $8,540,078 | $5,978 | Energy |
| Tellurian Inc. | Octávio M.C. Simões | $725,000 | $7,603,751 | $0 | $0 | $0 | $83,174 | $8,411,925 | $311 | Energy |
| Diamond Offshore Drilling, Inc. | Bernie Wolford Jr. | $437,837 | $456,438 | $7,303,326 | $0 | $0 | $5,865 | $8,203,466 | $701 | Energy |
| Expro Group Holdings N.V. | Michael Jardon | $1,149,618 | $1,008,900 | $5,952,714 | $0 | $0 | $12,000 | $8,123,232 | $1,224 | Energy |
| Patterson-UTI Energy, Inc. | William Andrew Hendricks, Jr. | $1,000,000 | $1,562,500 | $5,442,905 | $0 | $0 | $11,600 | $8,017,005 | $2,326 | Energy |
| Enterprise Products Partners L.P. | W. Randall Fowler | $731,250 | $2,400,000 | $3,898,125 | $0 | $0 | $753,389 | $7,782,764 | $58,186 | Energy |
| Select Energy Services, Inc. | John D. Schmitz | $576,923 | $664,643 | $6,521,966 | $0 | $0 | $3,231 | $7,766,763 | $1,261 | Energy |
| PROS Holdings, Inc. | Andres D. Reiner | $540,000 | $685,476 | $6,102,556 | $0 | $0 | $11,600 | $7,339,632 | $270 | Information Technology |
| TALOS ENERGY INC. | Timothy S. Duncan | $800,674 | $1,370,000 | $5,146,764 | $0 | $0 | $9,750 | $7,327,188 | $1,689 | Energy |
| NexTier Oilfield Solutions Inc. | Robert W. Drummond | $940,726 | $1,164,585 | $4,999,999 | $0 | $0 | $21,681 | $7,126,991 | $2,884 | Energy |
| Southwestern Energy Company | William J. Way | $900,000 | $1,650,000 | $4,402,539 | $0 | $31,073 | $93,772 | $7,077,384 | $14,569 | Energy |
| Archrock, Inc. | D. Bradley Childers | $710,937 | $1,453,200 | $4,375,869 | $0 | $0 | $69,266 | $6,609,272 | $822 | Energy |
| Stabilis Solutions, Inc. | Westervelt T. Ballard | $175,547 | $125,000 | $3,390,000 | $2,879,000 | $0 | $0 | $6,569,547 | $98 | Energy |
| LGI Homes, Inc. | Eric Lipar | $950,000 | $2,280,000 | $3,230,169 | $0 | $0 | $66,632 | $6,526,801 | $2,617 | Consumer Discretionary |
| Castle Biosciences Inc. | Derek J. Maetzold | $625,000 | $722,500 | $2,500,003 | $2,656,954 | $0 | $17,400 | $6,521,857 | $124 | Health Care |
| Oceaneering International, Inc. | Roderick A. Larson | $760,000 | $3,543,108 | $1,795,488 | $0 | $0 | $417,583 | $6,516,179 | $1,997 | Energy |
| NOW Inc. | David Cherechinsky | $650,000 | $1,032,646 | $3,309,101 | $996,734 | $0 | $0 | $5,988,481 | $2,021 | Industrials |
| U.S. Silica Holdings Inc. | Bryan A. Shinn | $850,000 | $1,190,290 | $3,889,770 | $0 | $0 | $36,263 | $5,966,323 | $1,397 | Energy |
| MRC Global Inc. | Robert J. Saltiel | $666,346 | $444,984 | $4,804,408 | $0 | $0 | $7,139 | $5,922,877 | $3,180 | Industrials |
| Kirby Corporation | David W. Grzebinski | $967,500 | $1,096,590 | $3,318,486 | $0 | $0 | $444,016 | $5,826,592 | $2,785 | Industrials |
| ChampionX Corporation | Sivasankaran Somasundaram | $841,087 | $988,390 | $3,932,766 | $0 | $0 | $13,050 | $5,775,293 | $3,806 | Energy |
| Callon Petroleum Company | Joseph C. Gatto | $865,000 | $2,718,028 | $2,092,309 | $0 | $0 | $34,142 | $5,709,479 | $3,219 | Energy |
| Exterran Corporation | Andrew J. Way | $825,000 | $948,750 | $3,900,009 | $0 | $0 | $11,600 | $5,685,359 | $761 | Energy |
| Prosperity Bancshares, Inc. | David Zalman | $1,041,712 | $1,612,548 | $2,666,214 | $0 | $0 | $213,699 | $5,534,173 | $1,150 | Financials |
| W&T Offshore, Inc. | Tracy W. Krohn | $1,000,000 | $2,007,700 | $1,892,602 | $0 | $0 | $592,419 | $5,492,721 | $887 | Energy |
| Carriage Services, Inc. | Melvin C. Payne | $900,000 | $1,200,000 | $0 | $3,204,500 | $0 | $42,281 | $5,346,781 | $372 | Consumer Discretionary |
| Stewart Information Services Corporation | Frederick H. Eppinger | $879,750 | $2,199,375 | $1,583,464 | $406,440 | $0 | $78,626 | $5,147,655 | $3,381 | Financials |
| Civeo Corporation | Bradley J. Dodson | $744,808 | $1,336,323 | $2,960,437 | $0 | $0 | $17,123 | $5,058,691 | $695 | Industrials |
| Main Street Capital Corporation | Dwayne L. Hyzak | $632,500 | $2,600,000 | $1,772,966 | $0 | $0 | $23,291 | $5,028,757 | $345 | Financials |
| Black Stone Minerals, L.P. | Thomas L. Carter | $433,317 | $1,039,961 | $3,365,562 | $0 | $0 | $14,500 | $4,853,340 | $734 | Energy |
| Sterling Infrastructure, Inc. | Joseph A. Cutillo | $790,000 | $1,659,790 | $2,346,190 | $0 | $0 | $46,296 | $4,842,276 | $1,879 | Industrials |
| Oil States International, Inc. | Cindy B. Taylor | $810,769 | $1,236,575 | $2,699,999 | $0 | $0 | $13,710 | $4,761,053 | $697 | Energy |
| LyondellBasell Industries N.V. | Ken Lane | $787,503 | $1,262,839 | $1,841,166 | $622,124 | $13,734 | $102,929 | $4,630,295 | $53,075 | Materials |
| Alaunos Therapeutics, Inc. | Kevin S. Boyle | $200,000 | $147,500 | $1,435,000 | $2,790,638 | $0 | $315 | $4,573,453 | $3 | Health Care |
| Team, Inc. | Amerino Gatti | $784,092 | $0 | $3,716,615 | $0 | $0 | $15,121 | $4,515,828 | $912 | Industrials |
| Comfort Systems USA, Inc. | Brian E. Lane | $792,000 | $1,321,739 | $2,375,954 | $0 | $0 | $13,394 | $4,503,087 | $3,879 | Industrials |
| Bristow Group Inc. | Christopher S. Bradshaw | $720,000 | $1,015,875 | $2,660,921 | $0 | $0 | $19,011 | $4,415,807 | $1,154 | Energy |
| Plains All American Pipeline, L.P. | Willie Chiang | $600,000 | $1,720,000 | $2,053,850 | $0 | $0 | $18,360 | $4,392,210 | $57,379 | Energy |
| Plains GP Holdings, L.P. | Willie Chiang | $600,000 | $1,720,000 | $2,053,850 | $0 | $0 | $18,360 | $4,392,210 | $57,379 | Energy |
| TETRA Technologies, Inc. | Brady M. Murphy | $589,615 | $1,680,798 | $1,975,810 | $0 | $0 | $7,703 | $4,253,926 | $519 | Energy |
| U.S. Physical Therapy, Inc. | Christopher J. Reading | $896,154 | $1,125,000 | $2,120,100 | $0 | $0 | $2,322 | $4,143,576 | $536 | Health Care |
| Quanex Building Products Corporation | George L. Wilson | $675,000 | $2,362,500 | $1,023,660 | $0 | ($3,822) | $49,783 | $4,107,121 | $1,222 | Industrials |
| Lexicon Pharmaceuticals, Inc. | Lonnel Coats | $688,825 | $438,645 | $838,000 | $1,946,000 | $0 | $12,620 | $3,924,090 | $0 | Health Care |
| CVR Energy, Inc. | David L. Lamp | $1,000,000 | $1,710,000 | $1,196,795 | $0 | $0 | $3,564 | $3,910,359 | $10,329 | Energy |
| Howard Hughes Corporation, The | David O Reilly | $750,000 | $1,800,000 | $1,286,662 | $0 | $0 | $14,500 | $3,851,162 | $1,932 | Real Estate |
| Applied Optoelectronics, Inc. | Chih-Hsiang (Thompson) Lin | $539,259 | $146,987 | $2,915,291 | $0 | $0 | $26,359 | $3,627,896 | $216 | Information Technology |
| Target Hospitality Corp. | James B. Archer | $660,000 | $2,045,274 | $426,190 | $423,913 | $0 | $26,012 | $3,581,389 | $431 | Consumer Discretionary |
| Summit Midstream Partners, LP | J. Heath Deneke | $600,000 | $1,377,753 | $1,531,500 | $0 | $0 | $52,577 | $3,561,830 | $384 | Energy |
| Par Pacific Holdings, Inc. | William Pate | $700,000 | $457,485 | $1,159,192 | $1,226,009 | $0 | $0 | $3,542,686 | $6,806 | Energy |
| Ring Energy, Inc. | Paul D. McKinney | $480,000 | $518,400 | $2,464,517 | $0 | $0 | $30,200 | $3,493,117 | $292 | Energy |
| SilverBow Resources, Inc. | Sean C. Woolverton | $590,000 | $1,539,900 | $1,205,045 | $0 | $0 | $18,600 | $3,353,545 | $706 | Energy |
| Earthstone Energy, Inc. | Robert J. Anderson | $447,500 | $500,000 | $2,284,800 | $0 | $0 | $17,400 | $3,249,700 | $1,344 | Energy |
| Dril-Quip, Inc. | Jeffrey J. Bird | $460,000 | $418,600 | $2,269,282 | $0 | $0 | $15,600 | $3,163,482 | $343 | Energy |
| Great Lakes Dredge & Dock Corporation | Lasse J. Petterson | $755,000 | $710,455 | $1,366,286 | $0 | $0 | $272,063 | $3,103,804 | $712 | Industrials |
| National Energy Services Reunited Corp | Sherif Foda | $840,000 | $1,589,595 | $666,400 | $0 | $0 | $0 | $3,095,995 | $879 | Energy |
| Tidewater Inc. | Quintin V. Kneen | $500,000 | $400,000 | $1,098,830 | $956,293 | $0 | $19,390 | $2,974,513 | $566 | Energy |
| Helix Energy Solutions Group, Inc. | Owen Kratz | $700,000 | $929,670 | $1,247,319 | $0 | $0 | $0 | $2,876,989 | $754 | Energy |
| IES Holdings, Inc. | Jeffrey L. Gendell | $750,000 | $300,000 | $1,823,000 | $0 | $0 | $900 | $2,873,900 | $2,261 | Industrials |
| Archaea Energy Inc. | Nicholas Stork | $0 | $500,000 | $2,349,000 | $0 | $0 | $0 | $2,849,000 | $621 | Financials |
| Bellicum Pharmaceuticals, Inc. | Richard A. Fair | $625,910 | $249,190 | $0 | $1,786,412 | $0 | $21,433 | $2,682,945 | $2 | Health Care |
| SEACOR Marine Holdings Inc | John Gellert | $450,000 | $450,000 | $1,696,974 | $0 | $0 | $5,800 | $2,602,774 | $207 | Energy |
| Gulf Island Fabrication, Inc. | Richard W. Heo | $394,286 | $915,000 | $1,169,500 | $0 | $0 | $0 | $2,478,786 | $130 | Energy |
| CVR Partners LP | Mark A. Pytosh | $590,284 | $834,100 | $1,041,190 | $0 | $0 | $2,322 | $2,467,896 | $812 | Materials |
| Powell Industries, Inc. | Brett A. Cope | $512,000 | $940,550 | $780,160 | $0 | $95,687 | $54,081 | $2,382,478 | $553 | Industrials |
| DXP Enterprises, Inc. | David R. Little | $700.0 | $959.1 | $643.2 | $0.0 | $0.0 | $78.1 | $2,380.4 | $1,368 | Industrials |
| Contango Ore, Inc. | Rick Van Nieuwenhuyse | $379.2 | $350.0 | $946.6 | $371.0 | $0.0 | $236.0 | $2,282.8 | $0 | Materials |
| Via Renewables, Inc. | W. Keith Maxwell | $0.0 | $0.0 | $2,222.7 | $0.0 | $0.0 | $24.9 | $2,247.6 | $443 | Utilities |
| Whitestone REIT | James C. Mastandrea | $650.0 | $0.0 | $1,401.6 | $0.0 | $0.0 | $38.0 | $2,089.6 | $138 | Real Estate |
| Independence Contract Drilling, Inc. | J. Anthony Gallegos Jr | $418.5 | $350.3 | $0.0 | $1,294.5 | $0.0 | $7.5 | $2,070.8 | $155 | Energy |
| Orion Group Holdings Inc | Mark R. Stauffer | $686.3 | $0.0 | $1,322.2 | $0.0 | $0.0 | $23.7 | $2,032.2 | $714 | Industrials |
| Cactus, Inc. | Scott Bender | $225.3 | $259.9 | $1,533.2 | $0.0 | $0.0 | $13.4 | $2,031.8 | $631 | Energy |
| CSI Compressco LP | John E. Jackson | $439.2 | $489.2 | $900.0 | $0.0 | $0.0 | $10.7 | $1,839.0 | $340 | Energy |
| Smart Sand, Inc. | Charles E. Young | $525.0 | $105.0 | $1,142.7 | $0.0 | $0.0 | $48.1 | $1,820.8 | $217 | Energy |
| Ranger Energy Services, Inc. | Stuart N. Bodden | $150.0 | $150.0 | $1,458.8 | $0.0 | $0.0 | $2.7 | $1,761.5 | $577 | Energy |
| Newpark Resources, Inc. | Matthew S. Lanigan | $400.6 | $748.8 | $582.0 | $0.0 | $0.0 | $19.4 | $1,750.7 | $770 | Energy |
| Solaris Oilfield Infrastructure, Inc. | William A. Zartler | $250.0 | $215.0 | $1,250.0 | $0.0 | $0.0 | $0.0 | $1,715.0 | $282 | Energy |
| Genesis Energy, L P | Grant E. Sims | $650.0 | $975.4 | $0.0 | $0.0 | $0.0 | $8.2 | $1,633.5 | $2,657 | Energy |
| Ranger Oil Corp | Darrin J. Henke | $500.0 | $777.5 | $49.5 | $0.0 | $0.0 | $227.9 | $1,554.8 | $1,047 | Energy |
| RCI Hospitality Holdings, Inc. | Eric S. Langan | $1,436.5 | $0.0 | $0.0 | $0.0 | $0.0 | $108.7 | $1,545.2 | $268 | Consumer Discretionary |
| Moleculin Biotech, Inc. | Walter V. Klemp | $500.0 | $242.5 | $327.8 | $410.9 | $0.0 | $35.6 | $1,516.8 | $0 | Health Care |
| U.S. Energy Corp. | Ryan L. Smith | $240.0 | $800.0 | $453.0 | $0.0 | $0.0 | $14.5 | $1,507.5 | $34 | Energy |
| Sitio Royalties Corp | Bryan C. Gunderson | $300.0 | $300.6 | $802.0 | $0.0 | $0.0 | $77.2 | $1,479.8 | $320 | Energy |
| Forum Energy Technologies, Inc. | Neal Lux | $370.8 | $301.5 | $794.8 | $0.0 | $0.0 | $0.0 | $1,467.1 | $657 | Energy |
| Sunnova Energy International Inc. | William J. Berger | $450.0 | $500.0 | $500.0 | $0.0 | $0.0 | $15.4 | $1,465.4 | $427 | Utilities |
| Nine Energy Service, Inc | Ann G. Fox | $604.1 | $224.1 | $634.7 | $0.0 | $0.0 | $0.0 | $1,462.8 | $532 | Energy |
| Aravive, Inc. | Gail McIntyre | $404.2 | $149.4 | $0.0 | $848.6 | $0.0 | $8.9 | $1,411.1 | $9 | Health Care |
| Evolution Petroleum Corp | Jason E. Brown | $325.0 | $337.2 | $689.1 | $0.0 | $0.0 | $35.4 | $1,386.7 | $130 | Energy |
| Marker Therapeutics, Inc. | Peter Hoang | $416.9 | $209.0 | $0.0 | $748.2 | $0.0 | $0.0 | $1,374.1 | $7 | Health Care |
| NCS Multistage Holdings, Inc. | Robert Nipper | $300.0 | $208.1 | $792.5 | $0.0 | $0.0 | $17.8 | $1,318.4 | $152 | Energy |
| Salarius Pharmaceuticals, Inc. | David J. Arthur | $340.0 | $84.5 | $0.0 | $605.5 | $0.0 | $106.4 | $1,136.4 | $0 | Health Care |
| USD Partners LP | Dan Borgen | $518.2 | $0.0 | $576.1 | $0.0 | $0.0 | $0.0 | $1,094.3 | $42 | Energy |
| Bio-Path Holdings, Inc. | Peter H. Nielsen | $510.0 | $150.0 | $0.0 | $427.3 | $0.0 | $0.2 | $1,087.5 | $0 | Health Care |
| Allegiance Bancshares, Inc. | Steven F. Retzloff | $540.0 | $214.7 | $289.1 | $0.0 | $0.0 | $42.5 | $1,086.3 | $3 | Financials |
| Greenwich LifeSciences, Inc. | Snehal Patel | $115.0 | $392.5 | $491.6 | $0.0 | $0.0 | $0.0 | $999.1 | $0 | Health Care |
| Amplify Energy Corp. | Martyn Willsher | $350.0 | $175.0 | $437.5 | $0.0 | $0.0 | $17.4 | $979.9 | $446 | Energy |
| Battalion Oil Corporation | Richard H. Little | $500.0 | $450.0 | $0.0 | $0.0 | $0.0 | $21.0 | $971.0 | $367 | Energy |
| Orbital Infrastructure Group, Inc. | James F. O Neil | $753.6 | $0.0 | $8.9 | $120.0 | $0.0 | $47.8 | $930.3 | $305 | Industrials |
| Equus Total Return, Inc. | John A. Hardy | $457.5 | $450.0 | $0.0 | $0.0 | $0.0 | $0.0 | $907.5 | $0 | Financials |
| Sharps Compliance Corp. | David P. Tusa | $361.5 | $120.0 | $0.0 | $351.8 | $0.0 | $20.7 | $854.0 | $69 | Health Care |
| Adams Resources & Energy, Inc. | Kevin J. Roycraft | $400.0 | $291.0 | $74.3 | $0.0 | $0.0 | $31.2 | $796.5 | $3,264 | Energy |
| PrimeEnergy Resources Corporation | Charles E. Drimal, Jr. | $700.0 | $0.0 | $0.0 | $0.0 | $0.0 | $87.8 | $787.8 | $149 | Energy |
| Vertex Energy, Inc. | Benjamin P. Cowart | $366.2 | $205.9 | $0.0 | $120.1 | $0.0 | $38.8 | $731.0 | $1,883 | Energy |
| Vaalco Energy, Inc. | George W. M. Maxwell | $225.0 | $412.9 | $0.0 | $0.0 | $0.0 | $19.5 | $657.4 | $314 | Energy |
| KLX Energy Services Holdings, Inc. | Christopher J. Baker | $255.0 | $250.0 | $0.0 | $0.0 | $0.0 | $12.1 | $517.1 | $476 | Energy |
| Flotek Industries, Inc. | John W. Gibson Jr. | $498.5 | $0.0 | $0.0 | $0.0 | $0.0 | $16.6 | $515.0 | $100 | Materials |
| Geospace Technologies Corporation | Walter R. Wheeler | $305.1 | $71.4 | $108.7 | $0.0 | $0.0 | $9.4 | $494.6 | $89 | Energy |
| PEDEVCO Corp. | Simon Kukes | $0.0 | $0.0 | $417.0 | $0.0 | $0.0 | $0.0 | $417.0 | $29 | Energy |
| ENGlobal Corporation | Mark A. Hess | $270.2 | $30.2 | $50.0 | $0.0 | $0.0 | $10.6 | $361.0 | $39 | Energy |
| Magnolia Oil & Gas Corp | Stephen I. Chazen | $326.0 | $0.0 | $0.0 | $0.0 | $0.0 | $23.2 | $349.2 | $1,678 | Energy |
| Camber Energy, Inc. | Louis G. Schott | $300.0 | $0.0 | $0.0 | $0.0 | $0.0 | $34.5 | $334.5 | $1 | Energy |
| Houston American Energy Corp | John Terwilliger | $101.7 | $6.5 | $0.0 | $195.2 | $0.0 | $0.0 | $303.4 | $2 | Energy |
| MIND Technology, Inc. | Robert P. Capps | $255.0 | $0.0 | $0.0 | $0.0 | $0.0 | $12.1 | $267.1 | $26 | Energy |
ABOUT OUR DATA
Compensation data was aggregated from proxy statements and annual reports filed during the period January 1, 2022 – December 31, 2022. Zayla is a compensation consulting firm serving public, private, not-for-profit and public administration organizations across the United States, including Houston, Dallas/Fort Worth, Austin/San Antonio, Denver and Louisiana.
SIMILAR ANALYSIS
Highest Paid CEOs: Dallas/Fort Worth, Austin/San Antonio, Denver, Louisiana
SOURCES
S&P Capital IQ
Securities & Exchange Commission (SEC) filings